Filtering Events
The filters at the top of the screen allow you to search all events processed by your workflows. You can filter by the event’s Status, time of initiation or by the Workflow name.The filters are scoped to the current workspace. If you’re not seeing the events or workflow you’re expecting, try switching workspaces.
Filtering by status
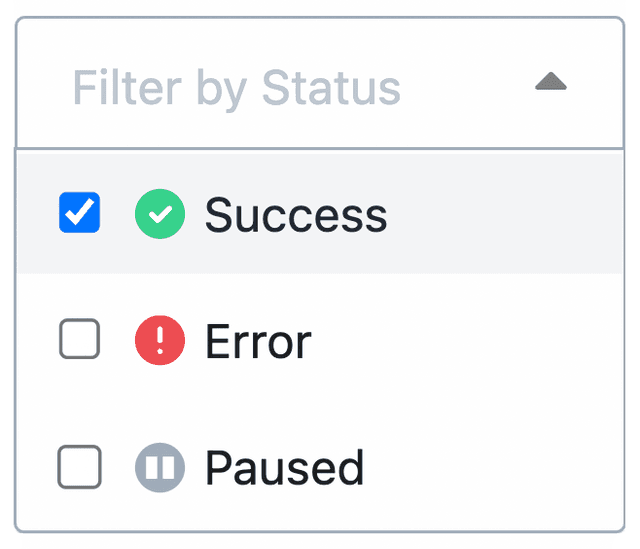
- The Status filter controls which events are shown by their status
- For example selecting the Success status, you’ll see all workflow events that were successfully executed
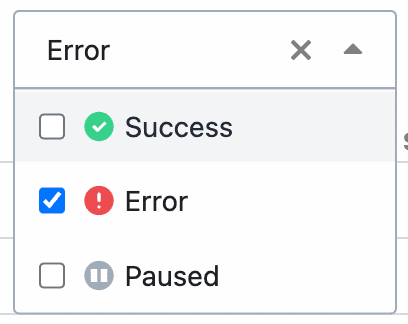
All failed workflow executions
- You can view all failed workflow executions by applying the Error status filter
- This will only display the failed workflow executions in the selected time period
- This view in particular is helpful for identifying trends of errors, or workflows with persistent problems
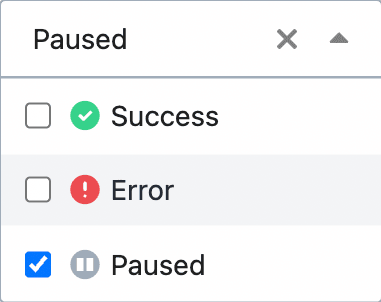
All paused workflow executions
- Workflow executions that are currently in a suspended state from
$.flow.delayor$.flow.suspendwill be shown when this filter is selected
If you’re using
setTimeout or sleep in Node.js or Python steps, the event will not be considered Paused. Using those language native execution holding controls leaves your workflow in a Executing state.Within a timeframe
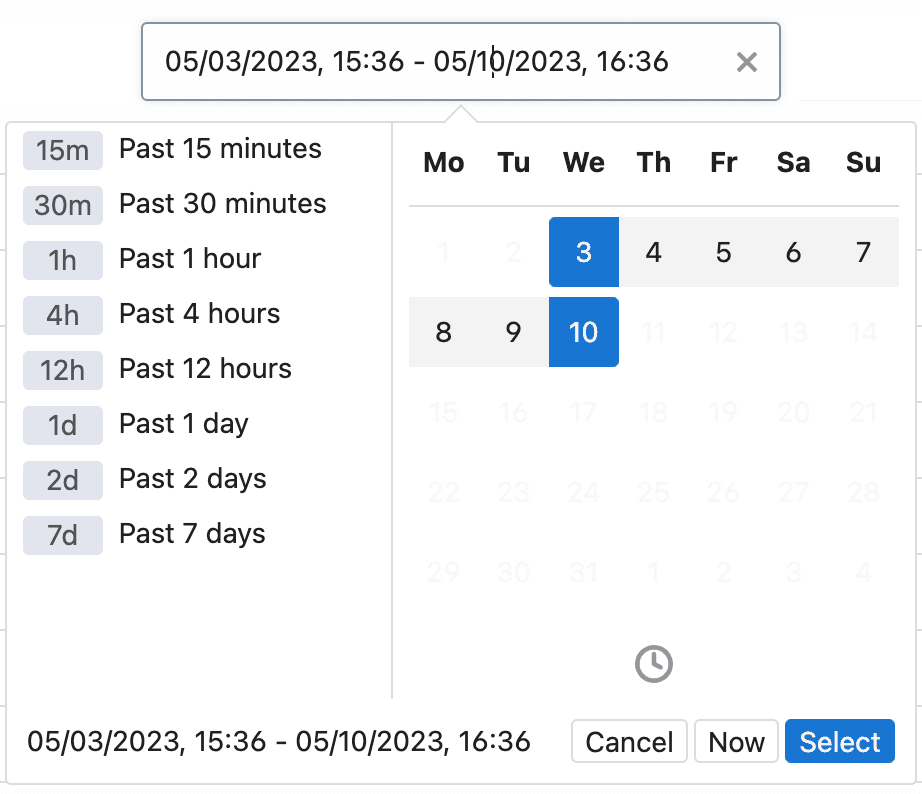
- Filtering by time frame will include workflow events that began execution within the defined range
- Using this dropdown, you can select between convenient time ranges, or specify a custom range on the right side
Filtering by workflow
You can also filter events by a specific workflow. You can search by the workflow’s name in the search bar in the top right.

Inspecting events
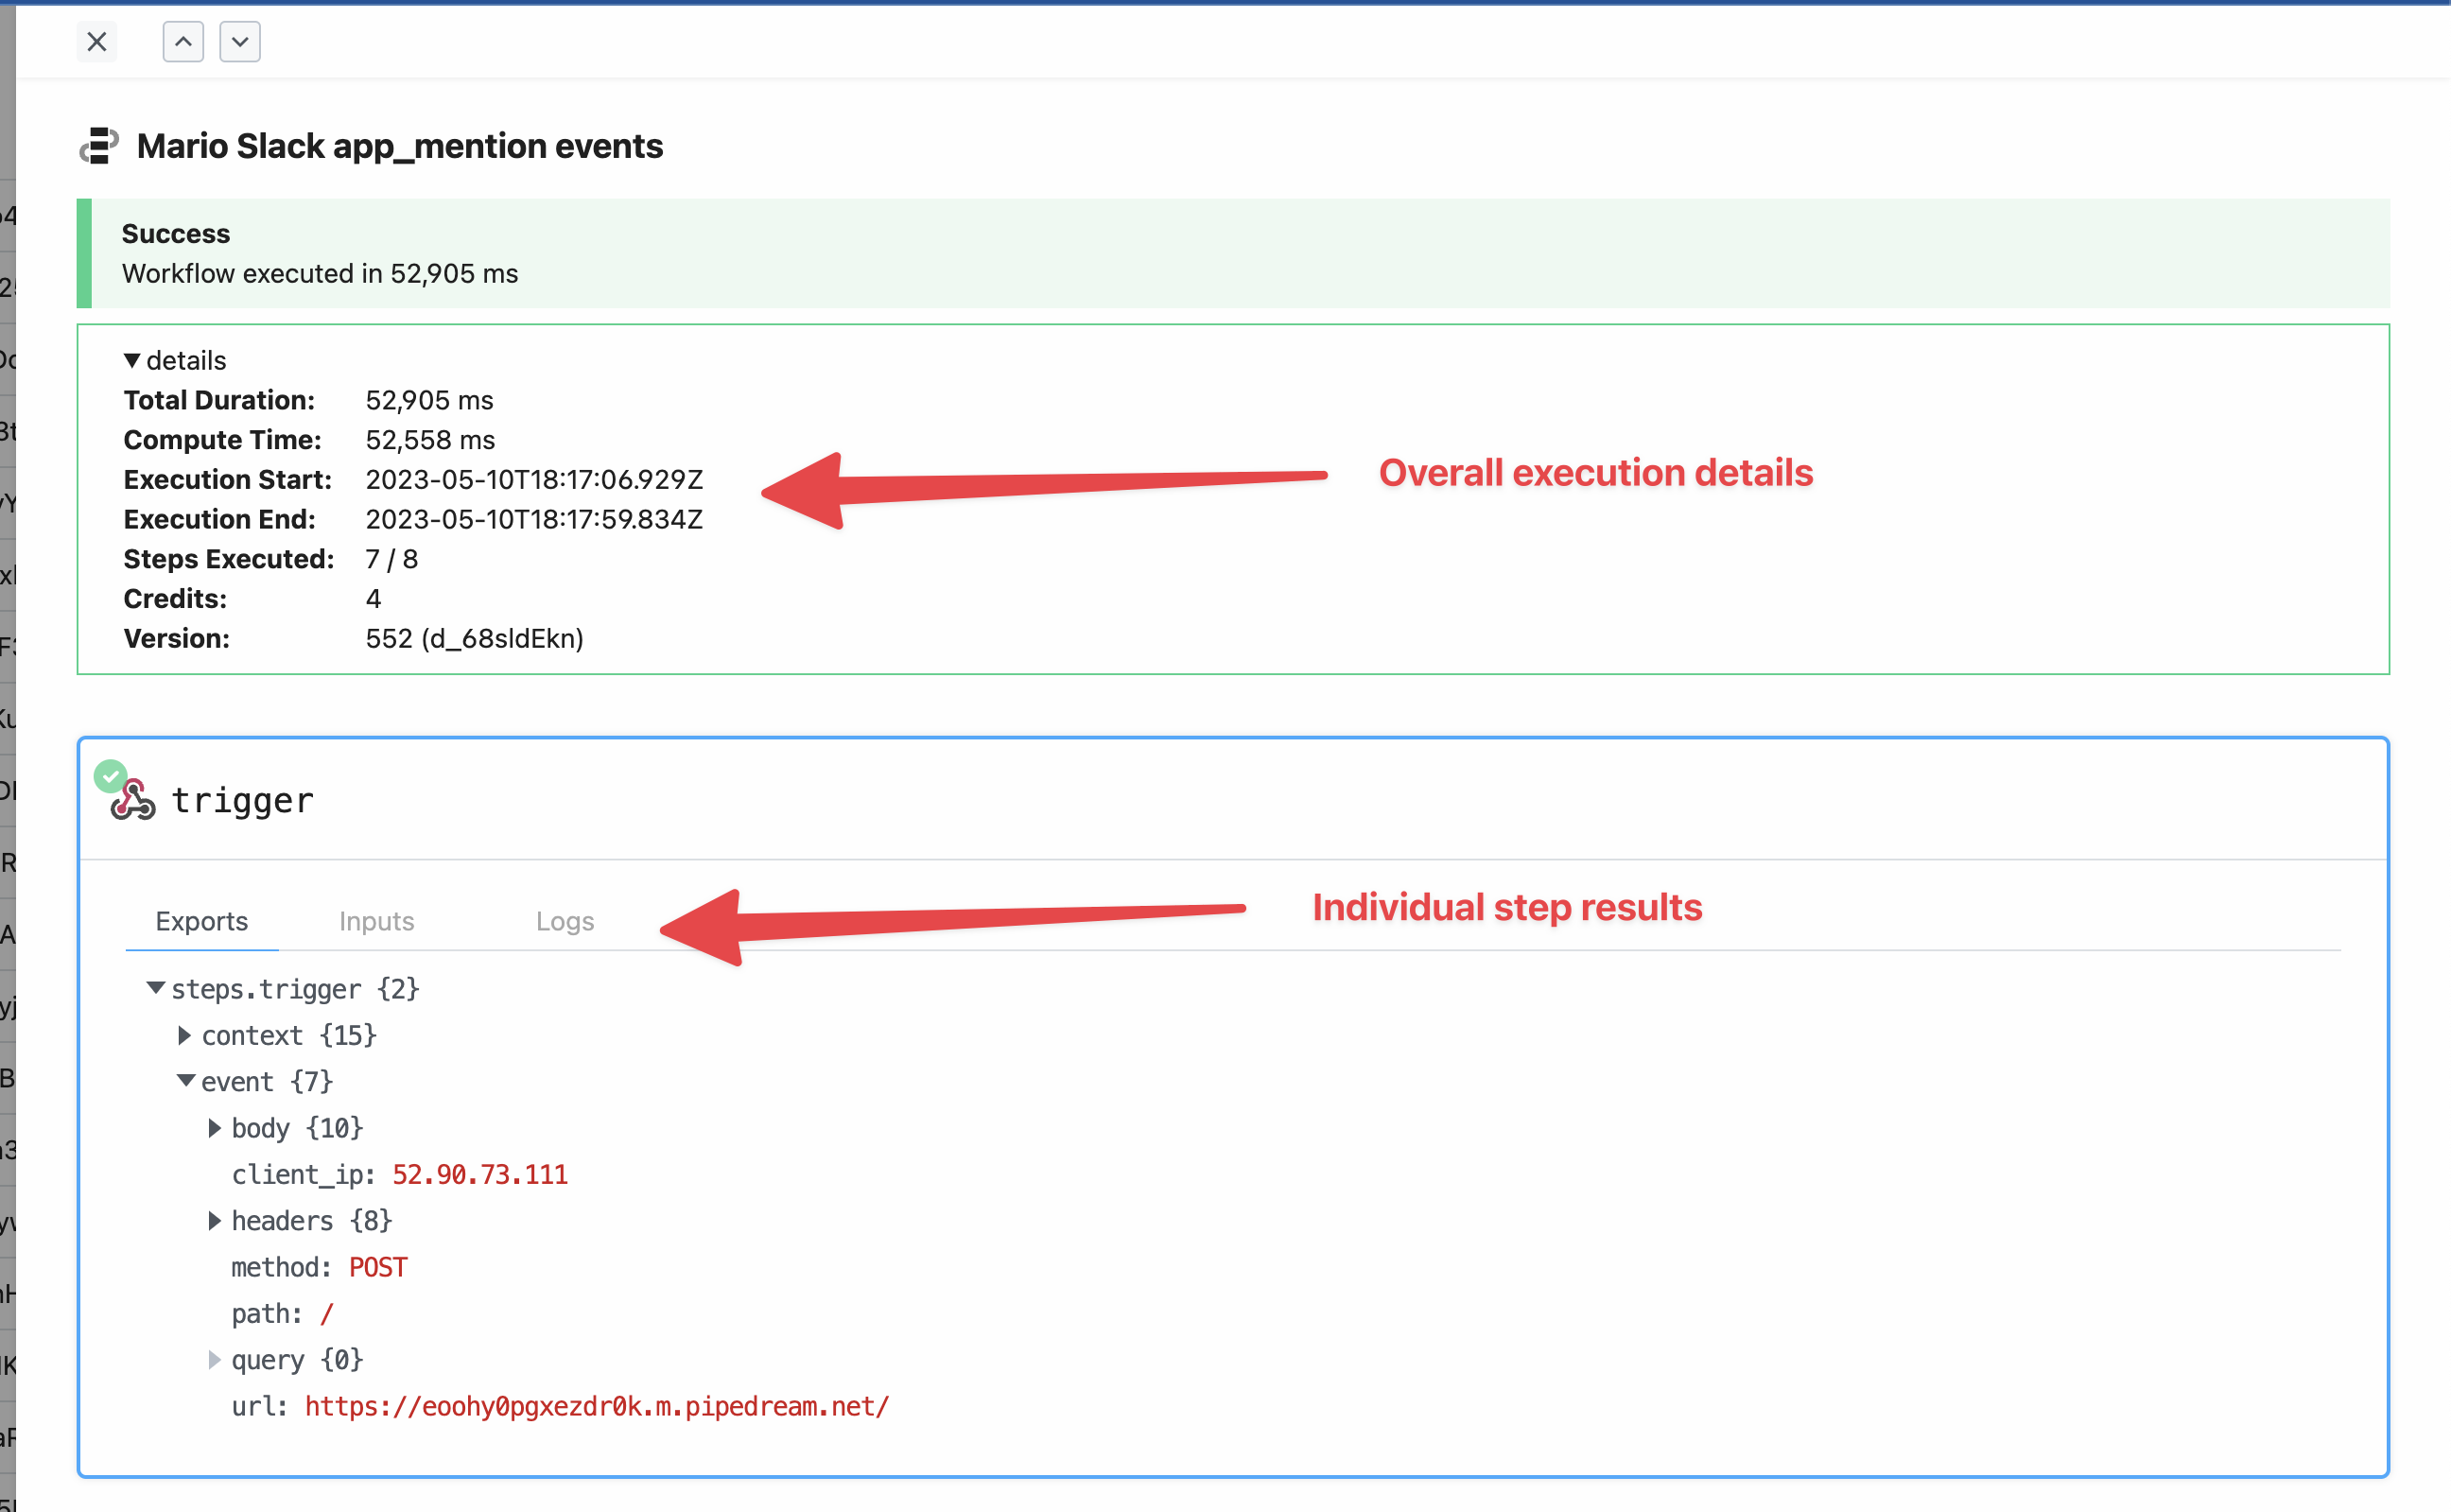
- Clicking on an individual event will open a panel that displays the steps executed, their individual configurations, as well as the overall performance and results of the entire workflow.
- The top of the event history details will display details including the overall status of that particular event execution and errors if any.
- If there is an error message, the link at the bottom of the error message will link to the corresponding workflow step that threw the error.
- From here you can easily Build from event or Replay event
Bulk actions
You can select multiple events and perform bulk actions on them.- Replay: Replays the selected events. This is useful for example when you have multiple errored events that you want to execute again after fixing a bug in your workflow.
- Delete: Deletes the selected events. This may be useful if you have certain events you want to scrub from the event history, or when you’ve successfully replayed events that had originally errored.
When you replay multiple events at once, they’ll be replayed in the order they were originally executed. This means the first event that came in will be replayed first, followed by the second, and so on.